2023 Valentine’s Statistics You Need //
To ensure that your Valentine’s Day email marketing strategy is on track, make sure you have a look at some important Valentine’s statistics.
Knowing more about your customers’ buying habits is one of the most important sales holidays. This will allow you to create more targeted email campaigns, ads and materials for them that will increase your conversions.
We have compiled some significant Valentine’s statistics that you can view below:
-
Valentine’s Email Marketing Statistics
-
Valentine’s Day Statistics
-
Valentine’s Day Demographics
-
Valentine’s Day Gift Shopping Statistics
-
The Most Popular Valentine’s Day Gifts
Let’s take a look at them:
Valentine’s Email Marketing Statistics
Email marketing can be a great way to increase your Valentine’s Day sales. It will show your customers exactly what they need in order to make their loved ones and family members happy.
Let’s now see the data collection by eDataSource.
Email campaigns sent by product category
Below is the average number Valentine’s Day emails sent between January 15th and February 14th.
- Flowers: 38.3
- Mass merchants21
- Chocolate: 21.3
- Jewelry: 7.4
You can see that flower businesses sent the most email marketing campaigns to promote Valentine’s Day gifts.
Email Campaign Open Rate By Category
- Flowers: 17.2%
- Mass merchants15.2%
- Chocolate: 11%
- Jewelry: 9%
The highest open rate was again recorded for the flower category, indicating that Valentine’s Day email marketing campaigns involving popular products are a success.
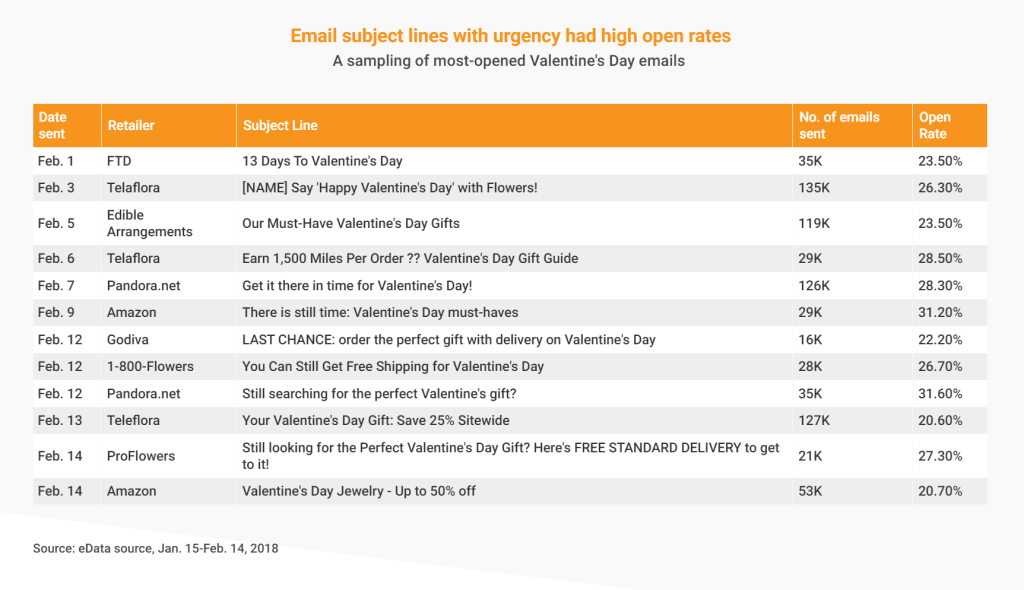
Email Subject line Performance (Open Rate).
Your Valentine’s Day subject lines will determine if an email campaign receives high open rates or low.
Below are some of the most opened Valentine’s Day email from various retailers such as Amazon, Pandora and Godiva.
Valentine’s Day Statists
Valentine’s Day spending has grown, with $16.9B starting in 2007 and rising to $27.4B by 2020.
The COVID-19 pandemic, which halted Valentine’s Day plans like restaurant dates, may have contributed to the 2021 drop. However, spending rose to $23.8B in 2022 after some Covid-19 health measures were removed.
Let’s now look at some spending statistics:
- Candy is the most requested gift, at 56%. Next are greeting cards at 40 percent and flowers at 37%. National Retail Federation (NRF).
- It is also a popular choice, with jewelry sales reaching $4.1B in 2021. -NRF
- The average spending for a significant other by millennials (23-29) is $266. –Bankrate
- With an average spending of $109, older millennials spend less than younger people. -Bankrate
Valentine’s Day Demographics
Spending is influenced by demographics. Let’s look at some statistics to see how Valentine’s Day consumers spend their money.
- 67.68% said that they would buy Valentine’s gifts for loved ones. –Finder
- 86% of millennials aged 23-29 will spend more money on gifts. – Bankrate
- With an average spend of $339, men are more likely than women to spend more money on gifts. Bankrate
- On the other side, women spend an average $64. -Bankrate
- Generation X and younger millennials have the highest spending habits, with plans to spend $266 and $268 respectively. -Bankrate
- The lowest numbers are for older millennials and those of silent generation, at $109 and $111 respectively. -Bankrate
Valentine’s Day Gift Shopping Statistics
Certain events (COVID-19), as well as other economic factors, have clearly influenced holiday sales. Let’s look at how the global pandemic changed consumer shopping habits.
- 41% of Valentine’s Day shoppers chose e-commerce as the best option. -NRF
- More specifically, 36.55% chose Amazon as their V-day gift shop. –Finder
- 46.97% opted for brick-and-mortar shops over other online retailers. – Search
- Amazon is more popular than brick-and-mortar shops (38.55%) and Amazon (38.545%). -Finder
- Women prefer DIY gifts more than men. -Finder
- Women purchase 85% of Valentine’s Day cards. -Greeting Card Association
- 16.48% of Valentine’s Day shoppers did their own gift shopping (DIY). -Finders
- 32% of shoppers visited department stores, 28% visited discount stores, 18% visited local businesses, and 17% visited florists. -NRF
The Most Popular Valentine’s Day Gifts
Below are the results of Statista. You can see the top Valentine’s Day products, with candy the most popular and pets the least.
These are the most requested options:
- 44% of shoppers said they would buy candy/sweets, with a box of chocolates a must.
- 33% of respondents choose to send greeting cards and 32% flowers. 29% prefer a romantic dinner.
- Red roses make up almost 70% of all flowers in the US. The Society of American Florists
- Shoppers also have great options with 14% and 13% selected wine, gift cards, and other products.
Here are the less popular:
- Buy clothing and perfumes/colognes at 8%
- 7% spend on lingerie and pajamas.
- 5% select a romantic vacation, while 4% choose cosmetics/beauty items.
- Only 1% of pet owners will adopt a pet.
Some people can’t decide every year (11%).
These statistics can be used to boost your V-day marketing efforts and offer indecisive customers great ideas and products. You can assist them in a busy day with a personalized promo email and increase your sales.
You can get started by using Moosend’s online email builder to customize any of the Valentine’s Day templates.
Plan Your Valentine’s Day Advertising
You can plan your Valentine’s Day marketing better by understanding how people behave during one of the most important holidays in the year.
The best way to reach them is by using the Valentine’s Day statistics. You can also use demographic data to create targeted campaigns for customers using special products.
Email marketing is one of most cost-effective ways to promote your company. It is essential that you use it during V-day. With advanced software, you can create stunning email marketing messages.
Sign up for a free account to get an email marketing cupid.
It’s now time to make Valentine’s Day special and increase your seasonal income!
The post Essential Valentine’s Stats To Use In 2023 was first published on Email marketing Automation Platform for Thriving Business.